Am I Trading Too Big for My Drawdown Rules?
What you will find out: Whether your funded risk per trade is appropriate for the drawdown rules of your account, and what a safer or more efficient sizing looks like.
Why This Happens
A funded account’s trailing drawdown does not give you unlimited time to recover from a bad run. Every losing day permanently reduces the distance between your current balance and the breach level. If your average red day is a large fraction of your total drawdown budget, a short losing streak can end the account before your edge has a chance to work.
Most traders who blow funded accounts early are not trading a losing strategy. They are trading a winning strategy at a size that does not fit the account’s risk rules.
What to Configure
Simulation Section
- Win Rate, Avg Win, Avg Loss — your real numbers. Do not adjust these upward.
- Min / Max Trades Per Day — your actual daily frequency.
Prop Firm Section — Funded Mode
- Firm and Account Size — match your real account.
- Funded Risk Per Trade — enter what you are currently risking per trade. This is the number you are testing.
- Daily Stop Rules — if you use a daily loss limit in real life, enable it here. It may be protecting you more than you realize.
What to Look At
Blown Before Done
The headline figure that tells you whether your sizing is the problem.
- Below 25% — your sizing fits the account rules reasonably well.
- 25% to 50% — worth investigating. Check the payout breakdown to see where accounts are dying.
- Above 50% — your risk per trade is too high for the drawdown rules at your current win rate and avg loss.
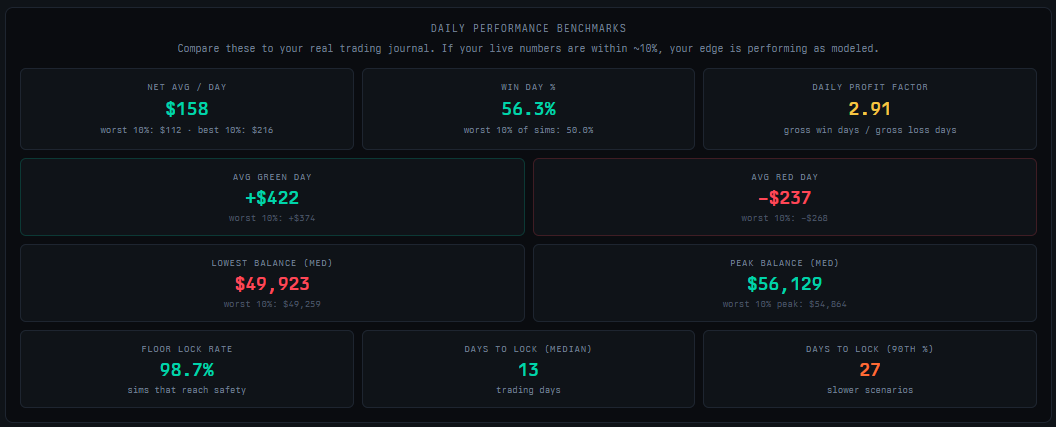
Daily Performance Benchmarks
Find the Avg Red Day figure in this section and compare it to your account’s total trailing drawdown.
A simple check: if your Avg Red Day is $600 and your trailing drawdown is $2,000, you have roughly 3 bad days of buffer before the account is at serious risk. If your Avg Red Day is $300, you have 6 bad days of buffer, which is considerably more comfortable.
Also check the Lowest Balance Hit at the P90 level. This is how low the account went in the worst 10% of simulations. If this is close to your drawdown floor, your sizing is leaving almost no margin.
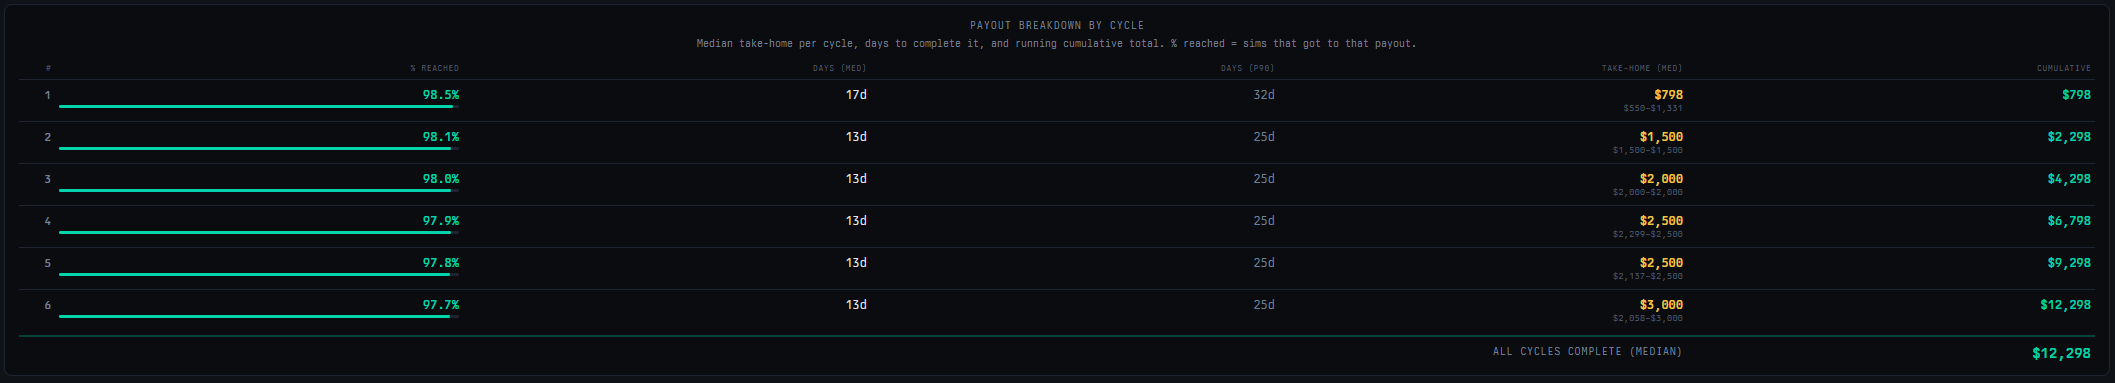
Payout Breakdown by Cycle
The table shows what percentage of simulations reached each payout slot. A healthy account shows gradual decay across the ladder. A sharp drop between two cycles means most accounts are blowing at that stage — that is where your sizing is hitting its limit.
What to Do If Your Sizing Is Too High
Run the Risk Optimizer from the Funded tab with the slider toward the conservative end (0 to 30). In most cases, dropping risk by 20 to 30 percent produces only a modest reduction in take-home but a significant improvement in account survival.
See the full walkthrough in What Risk Per Trade Should I Use?
The Question to Ask Yourself
How many consecutive red days at your current sizing would breach the drawdown floor? If the answer is fewer than five, you are almost certainly oversized for the account rules. A short bad run should be survivable. If it is not, your edge never gets the sample size it needs to perform.
Next Steps
- What Risk Per Trade Should I Use? — run the optimizer to find a sizing that fits both your income goals and the account’s drawdown structure.
- How Much Can I Realistically Make on a Funded Account? — re-run the funded sim with the adjusted risk to get an updated income projection.