Is Running Multiple Accounts Worth It?
What you will find out: Whether a multi-account strategy improves your net income and income stability over time, what the realistic bad scenario looks like, and whether you have enough seed capital to sustain the fleet through a rough patch.
What to Configure
Fleet Mode inherits its rules from your Eval and Funded settings, so configure those first before switching to Fleet.
Step 1 — Set up Eval rules
In the Prop Firm section, switch to Eval mode and configure:
- Profit Target, Max Drawdown, Eval Cost
- Eval Risk Per Trade
- Time limit and daily loss limit if your firm uses them
Step 2 — Set up Funded rules
Switch to Funded mode and configure:
- Firm and Account Size
- Funded Risk Per Trade
- Daily stop rules if you use them
Step 3 — Switch to Fleet mode and set fleet parameters
- Initial Accounts — how many accounts you are starting with. Begin with 2 or 3 for your first run.
- Max Accounts — the ceiling on how many accounts can be active at once.
- Stagger — how many days apart each new account starts. 14 days is a reasonable starting point.
- Sim Days — the total period to model. 180 days gives you a meaningful picture of how the fleet develops.
- Seed Capital — the total cash you are willing to deploy on eval fees.
- Reinvest — when enabled, payouts are recycled back into funding new evals rather than being taken as income.
What to Look At
Net P&L and ROI
The headline Net P&L figure shows median gross payouts minus all eval costs, with P10 and P90 alongside it. The spread between P10 and P90 tells you how variable fleet income actually is. ROI on Eval Costs tells you whether the fleet is profitable relative to its entry costs — below 1x means your pass rate needs work before scaling up.

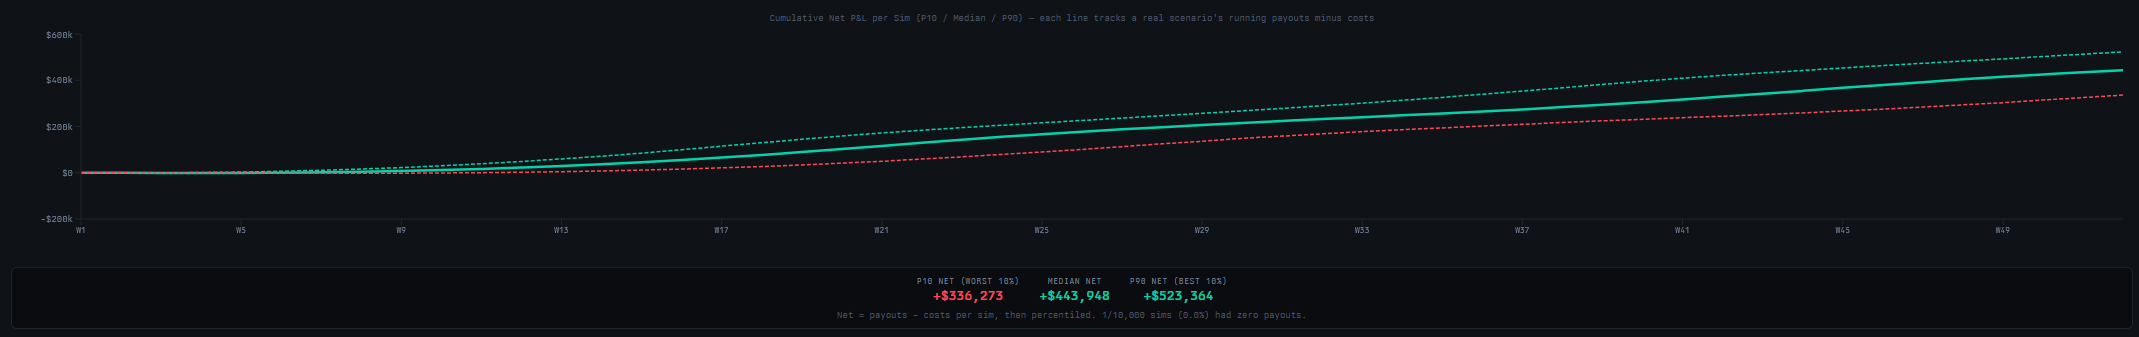
Cumulative Net P&L Chart
The three lines (P10, median, P90) show the running net P&L across the full simulation period.
- The median line is your expected trajectory.
- The P10 line is your realistic bad scenario. Check how deep it goes and whether it recovers within your time horizon. If it dips deeply negative and stays there, the fleet is burning through seed capital on bad runs.
Account Timeline
The Gantt chart shows each account’s lifecycle plotted along a shared time axis. Blue segments are the eval phase; green shades are funded cycles; red means the account blew; gold diamonds mark individual payout events. A healthy fleet has funded accounts staggered across the timeline rather than all resolving at the same time.
Monthly Fleet Income Chart
Shows payouts and eval costs per calendar month. Look for months where costs spike well above income — typically in the early months before enough accounts have entered the funded phase. Make sure your seed capital can cover these gaps.
The Question to Ask Yourself
Does the P10 scenario still work for your finances? Fleet mode improves the median outcome compared to a single account, but it does not eliminate bad runs. If the P10 cumulative line goes deeply negative before recovering, you need more seed capital, fewer simultaneous accounts, or a higher pass rate before the fleet strategy makes sense.
Next Steps
- Can My Edge Pass an Eval? — fleet results are only as good as your eval pass rate. If that is below 40%, fix it before scaling up.
- Am I Trading Too Big for My Drawdown Rules? — funded accounts that blow early are the biggest drag on fleet P&L. Check your funded sizing first.