How Much Can I Realistically Make on a Funded Account?
What you will find out: Your realistic income from a funded account across the full payout ladder, the probability of completing it without blowing the drawdown, and how long to expect before the first payout lands.
What to Configure
Simulation Section
- Win Rate, Avg Win, Avg Loss — your real trading stats, not an optimistic estimate.
- Min / Max Trades Per Day and Trading Days Per Week — these affect how the sim converts trading days into calendar time, which feeds the payout timing estimates.
- Number of Simulations — leave this at 25,000 for stable results. Go higher if you want tighter percentile estimates on completion rate.
Prop Firm Section — Funded Mode
- Firm — select Apex, LucidFlex, TradingPit, or Custom. Each preset loads the real drawdown rules, payout structure, consistency requirements, and trader split for that firm.
- Account Size — match what you are actually trading or planning to trade.
- Funded Risk Per Trade — this is the most important input here. Use what you actually plan to risk per trade on the funded account, not the eval risk.
- Daily Stop Rules — if you stop trading after hitting a daily profit target or loss limit in real life, enable those here. Leaving them off will overestimate your income.
What to Look At
Full Completion Rate and Blown Before Done
These two numbers bookend your range of outcomes. Completion rate is how often the account makes it through the full payout ladder. Blown before done is how often it fails entirely.
- Completion rate above 70% — your edge and sizing are well suited to the account rules.
- Blown rate above 40% — your funded risk per trade is likely too high for the drawdown rules. See Am I Trading Too Big?.

Median Take-Home
The 50th percentile total payout collected across all simulations, including partial completions from accounts that blew mid-ladder. This is the realistic income figure, not the best case. The maximum possible take-home is shown alongside it for comparison.
Days to First Payout
The median trading days to reach the first payout, with the P90 shown as the slow-case scenario. Pay attention to the P90. If your median is 18 trading days but your P90 is 45, a significant portion of accounts are taking much longer than expected to qualify.
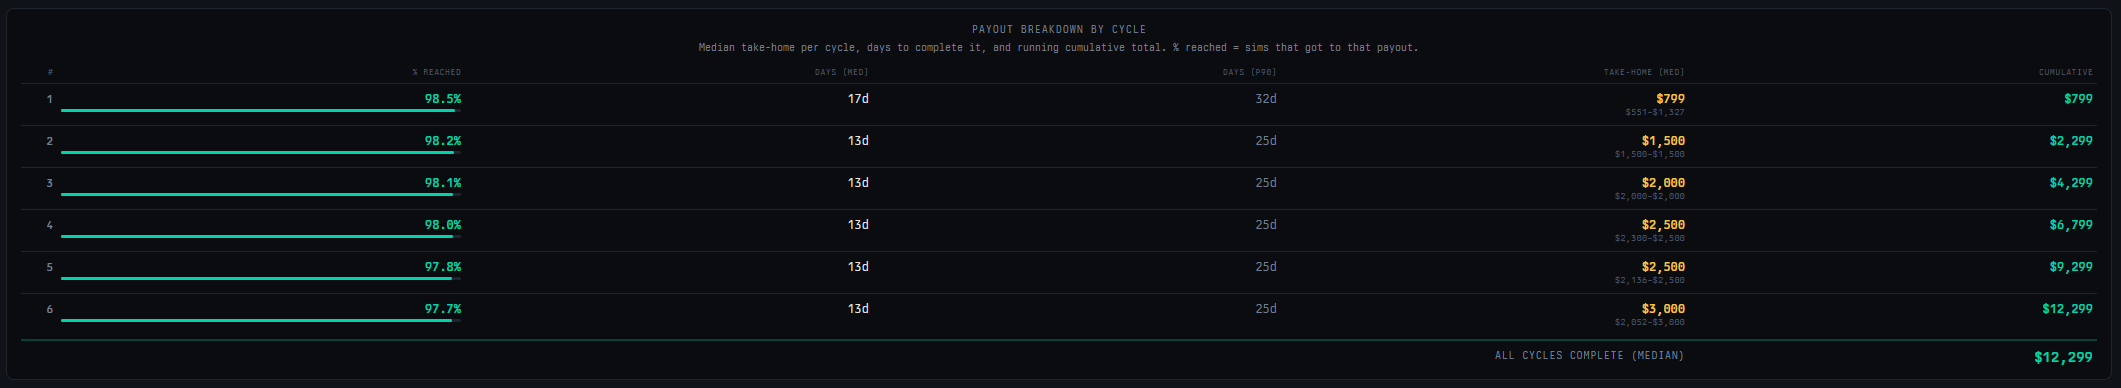
Payout Breakdown by Cycle
The table in the Funded PA tab shows each payout slot in the ladder with the percentage of simulations that survived long enough to attempt it. Watch for a sharp drop between cycles — that is where most accounts are blowing.
The Question to Ask Yourself
Does the median take-home justify the eval cost and the time to get there? The Eval mode shows you the expected cost to get funded. The Funded mode shows you what you collect once you are. Compare the two to decide whether the total investment makes sense for your situation.
Next Steps
- Am I Trading Too Big for My Drawdown Rules? — if your blown rate is high, this guide walks through how to find better sizing.
- Is Running Multiple Accounts Worth It? — if the single account income looks thin, fleet mode models what running several in parallel produces.