Can My Edge Pass a Prop Firm Eval?
What you will find out: Whether your win rate and R-multiples give you a realistic shot at passing any prop firm evaluation, how many attempts to budget for, and whether the math works out in your favor before you spend a dollar on fees.
The examples in this guide use an Apex 50k eval ($3,000 profit target, $2,000 max drawdown) as a reference point. The same process applies to any firm — just swap in your own firm’s rules.
What to Configure
Simulation Section
- Win Rate, Avg Win, Avg Loss — pull these from your trading journal, not your best month. Use your actual long-run numbers.
- Min / Max Trades Per Day — set this to your real daily range. This affects how the sim models trading days and time limits.
- Trading Days Per Week — typically 4 or 5 for futures traders.
Prop Firm Section — Eval Mode
Enter your firm’s specific rules here. Using Apex 50k as an example:
- Profit Target — $3,000
- Max Drawdown — $2,000 EOD trailing
- Eval Cost — the fee you actually pay per attempt
- Eval Risk Per Trade — start with what you trade in the market today. You can tune this with the optimizer afterward.
If you are not sure what risk per trade to use, run the sim once at your current sizing first, then check the Risk Optimizer guide to refine it.
What to Look At
Pass Rate
This is the most important number. It tells you what percentage of sim attempts passed the eval given your stats and the firm’s rules.
- Above 60% — solid. Most attempts succeed and your cost to get funded is predictable.
- 40% to 60% — workable, but budget for multiple attempts.
- Below 30% — something needs to change. Either your stats are not strong enough for the rules, your risk per trade is too high, or both.

Avg Attempts to Pass
This is 1 divided by your pass rate. A 50% pass rate means 2 attempts on average. Multiply this by your eval fee to get your expected total spend before passing.
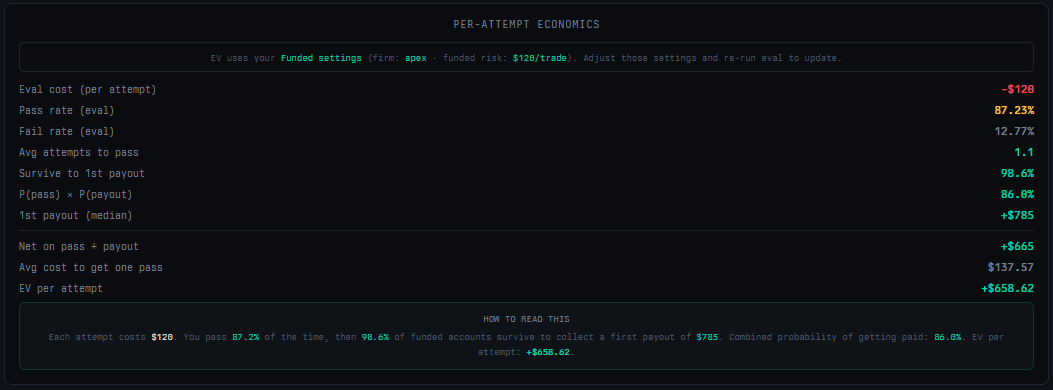
EV Per Attempt
This is the expected dollar value of a single eval attempt, factoring in the probability of passing, then surviving the funded account long enough to collect a first payout, minus the cost of failed attempts.
- Positive EV — the strategy is mathematically profitable per attempt on average.
- Negative EV — you are paying more in failed attempts than you are collecting in payouts. A higher pass rate, lower eval cost, or larger first payout would be needed to flip this.
Pass / Fail Timing Charts
Look at when attempts are resolving. If most failures are happening in the first 20 trades, your drawdown is getting hit early, which usually means risk per trade is too high. If failures cluster near the time limit, your edge is generating profit but not fast enough.
Closest-Call Analysis
Among the failing simulations, this shows how far they got before blowing. A high median peak profit in failing sims means failures were mostly bad luck after good starts. A low peak profit means the eval is routinely out of reach with your current settings.
The Question to Ask Yourself
If it takes 4 or more attempts on average to pass, is the first payout worth the total outlay? The per-attempt economics panel does this math for you explicitly. If the EV is negative and the expected cost to get funded is more than the first payout, your sizing or stats need adjustment before you start buying evals.
Next Steps
- What Risk Per Trade Should I Use? — run the optimizer to find the risk level that maximizes your pass rate or speeds up your path to funded.
- How Much Can I Realistically Make on a Funded Account? — once you know you can pass, model what the funded account actually pays out.