What Risk Per Trade Should I Use?
What you will find out: The risk per trade that the simulator recommends for your stats and firm rules, tuned to how conservative or aggressive you want to be.
Why This Matters
Risk per trade is the single biggest lever you have in a prop firm context. Too low and your edge takes too long to build profit, leaving you vulnerable to time limits and slow payout cycles. Too high and a normal losing streak blows the account before your edge can recover. The optimizer scans a range of values and finds the level where these two pressures are best balanced for your situation.
There are two separate optimizers depending on what you are trying to do:
- Eval optimizer — finds the risk level that minimizes expected days to get funded, subject to a minimum pass rate.
- Funded optimizer — finds the risk level that maximizes risk-adjusted take-home on the funded account, subject to a blow rate ceiling.
Run both if you want a complete picture.
Running the Eval Optimizer
Before you run it
Make sure your eval settings are configured first: profit target, max drawdown, eval cost, time limit if applicable. Your trading stats should reflect your real long-run numbers.
How to run it
- Run a standard Eval simulation first to get baseline results.
- In the results panel, click the Risk Optimizer tab.
- Set the Risk Preference slider. Lower values favor a higher pass rate and accept slower paths to funded. Higher values accept a lower pass rate in exchange for faster resolution when the account does pass.
- Click Run Optimizer.
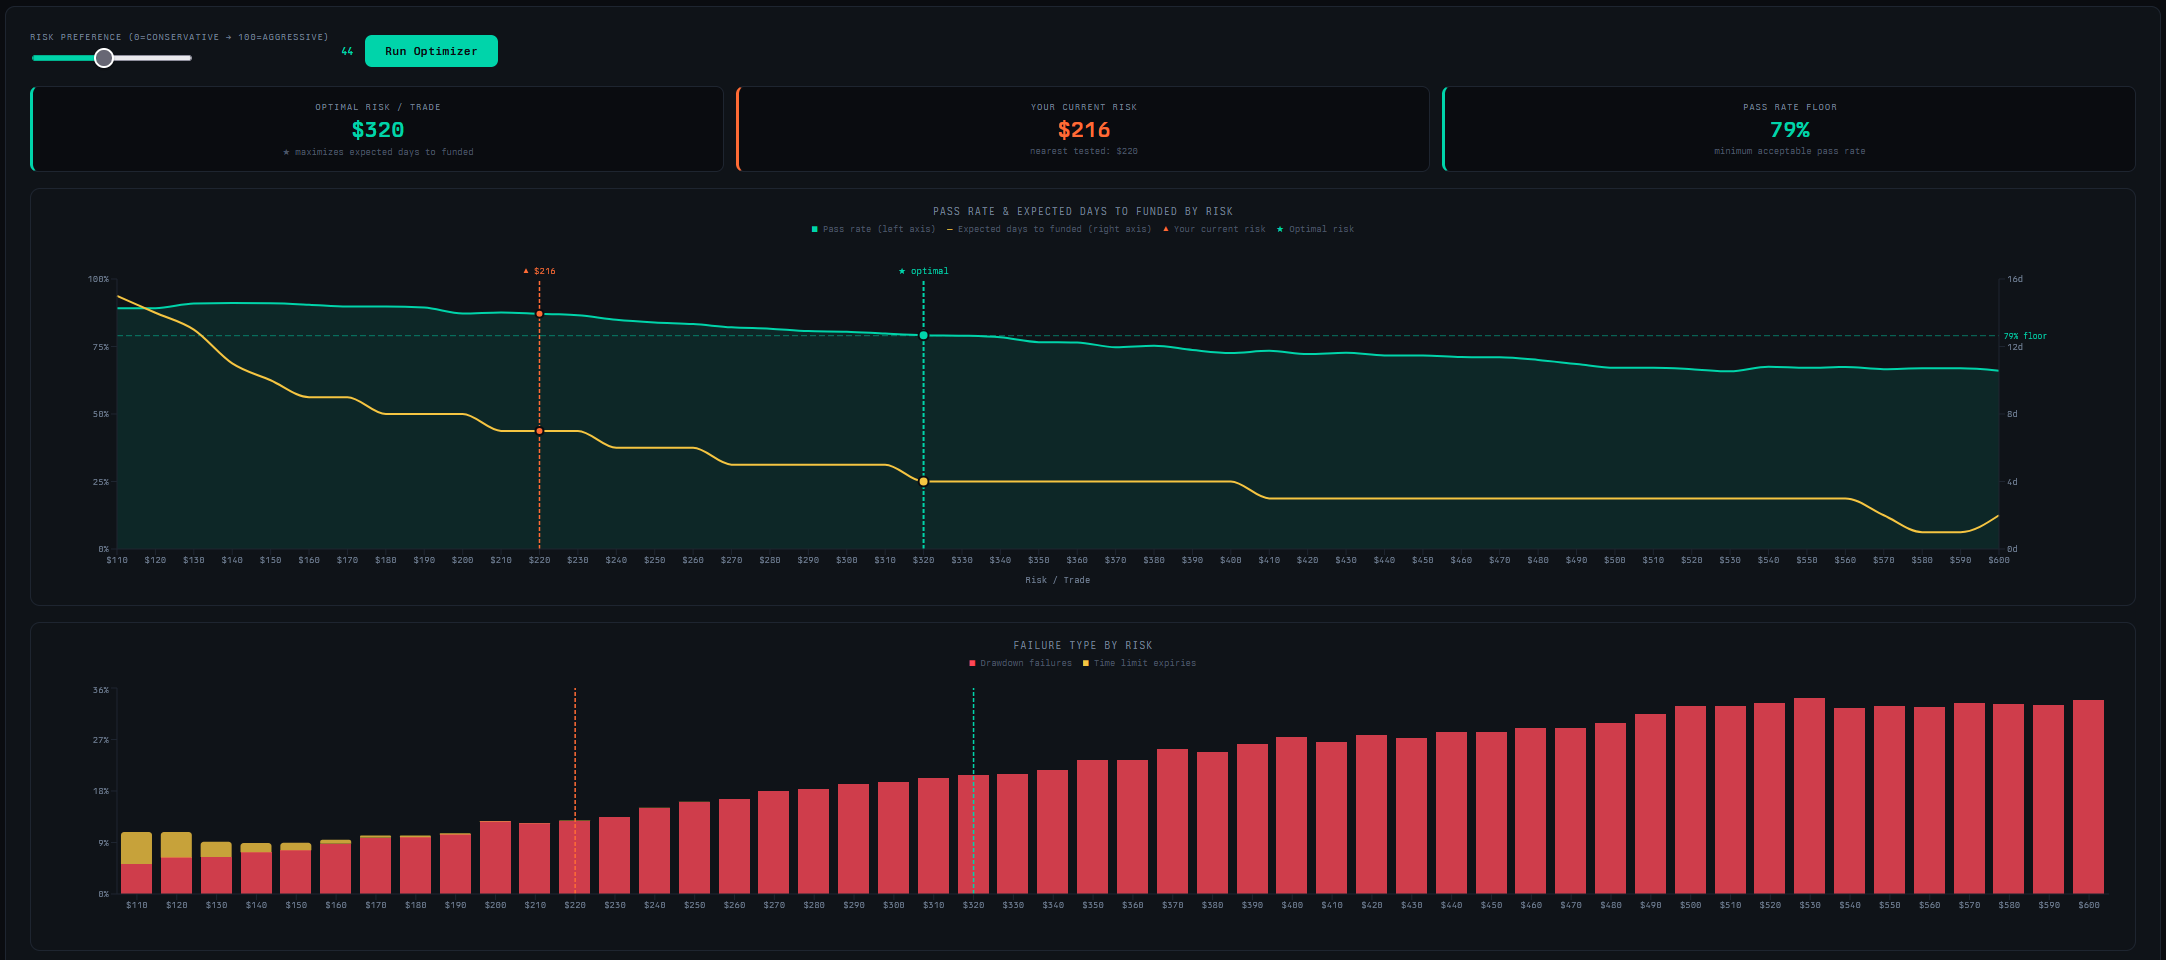
What to look at
- Optimal Risk Per Trade — the recommended level given your preference setting.
- Pass Rate vs. Expected Days chart — the green area is pass rate; the gold line is expected days to funded. Look for where the gold line bottoms out. That is the risk level that gets you funded fastest. Pushing further right past that point adds drawdown risk without speeding things up.
- Failure Type by Risk — if time expiries dominate at lower risk levels, increasing risk modestly will help. If drawdown failures dominate at your current level, you need to come down.
- Your Current Risk marker — if you are sitting well to the right of the optimal marker, you are taking on more risk than the math supports for your goals.
Running the Funded Optimizer
Before you run it
Make sure your funded settings are configured: firm, account size, funded risk per trade, and daily stop rules if you use them.
How to run it
- Run a standard Funded simulation first.
- Click the Risk Optimizer tab in the results panel.
- Set the Risk Preference slider toward 0 for a focus on account survival, or toward 100 to maximize take-home.
- Click Run Optimizer.
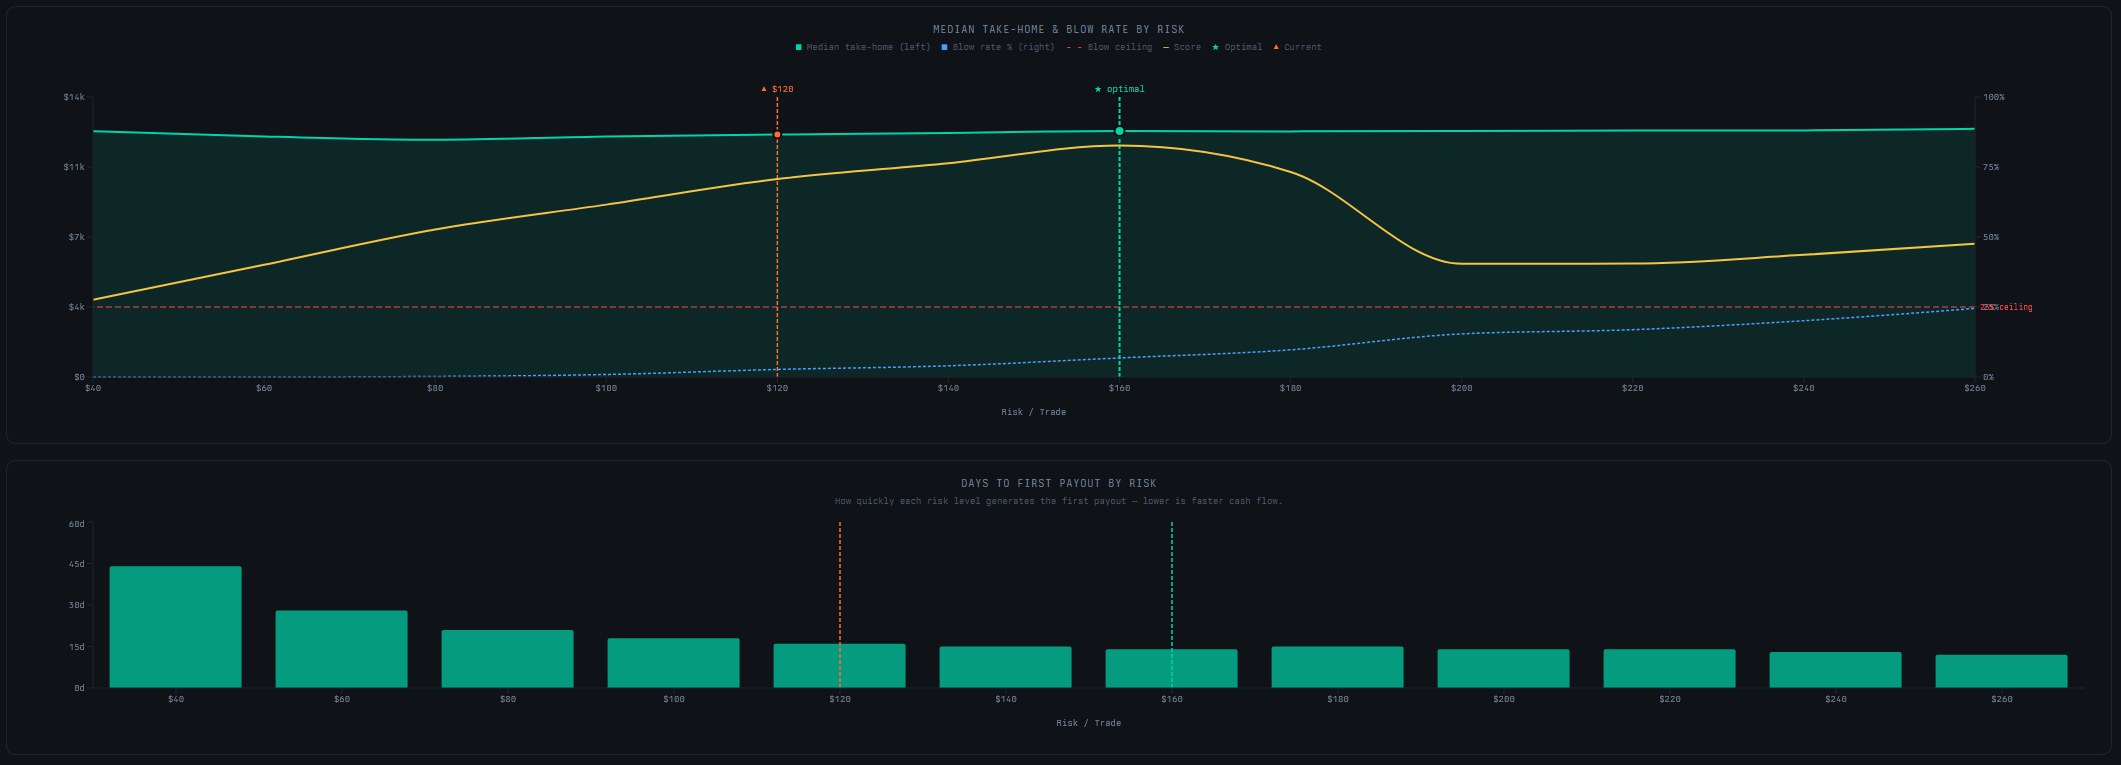
What to look at
- Optimal Risk Per Trade — the recommended funded risk level.
- Median Take-Home vs. Blow Rate chart — the gold composite score line peaks at the recommended risk level. Watch how steeply the blow rate rises past that point — a steep climb means there is not much room to push further.
- Days to First Payout by Risk — lower risk means slower cash flow. Check whether the recommended level produces a first payout timeline you can live with.
- Full Results Table — every tested risk level with completion rate, blow rate, median take-home, and days to first payout. Useful for comparing nearby levels if the recommendation does not feel right.
The Question to Ask Yourself
The slider makes your trade-off explicit. Before you run it, decide: are you optimizing for the highest chance of success, or the fastest expected path to a payout? These are different goals and they produce different optimal risk levels. Being clear about which one matters more to you will make the optimizer result more actionable.
Next Steps
- Can My Edge Pass an Eval? — once you have an optimal eval risk, re-run the eval sim to see how the pass rate and EV shift.
- How Much Can I Realistically Make on a Funded Account? — use the optimal funded risk to get an accurate income projection.